In this article, we’ll learn how to save several plots in a single pdf file. In many scenarios, we need our output to be in a specific format, which we can easily acquire in Python by utilizing the following method.
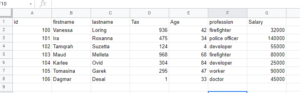
Let us take the demo.csv file as an example here to perform the task.
Saving Multiple matplotlib Figures in Single PDF File in Python
1)Importing libraries
# Import pandas module using the import keyword
import pandas as pd
# Import pyplot from matplotlib module using the import keyword
from matplotlib import pyplot as pplot
# Import seaborn module using the import keyword
import seaborn as sns
2)Reading a CSV File
# Pass some random CSV file to the read_csv() function of the pandas module
# to read the given csv file
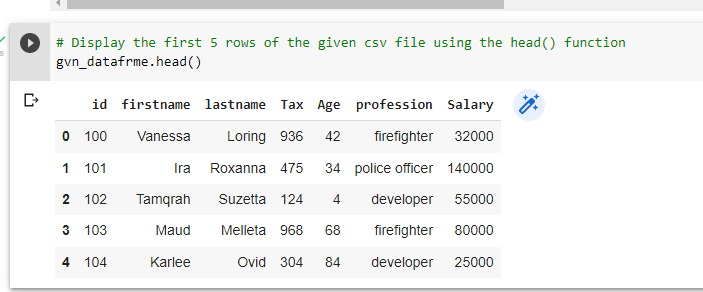
gvn_datafrme = pd.read_csv("demo.csv")3)Displaying the first 5 rows of the CSV file
# Display the first 5 rows of the given csv file using the head() function
gvn_datafrme.head()
Output:
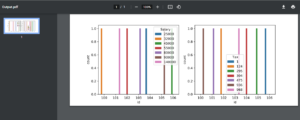
4)Plotting Multiple plots of a Given CSV File in a Single PDF File
# Passing some random plot size(width, length) to the figure() function
pplot.figure(figsize=(10, 4))
# Plot the subplot by passing the arguments rows, columns and order of the plot to the
# subplot() function
pplot.subplot(1, 2, 1)
# Plot the graph of id, Salary columns in a given CSV file using the countplot() function
# of the seaborn module
sns.countplot('id', hue='Salary', data= gvn_datafrme)
pplot.subplot(1, 2, 2)
# Plot the graph of id, Tax columns in a given CSV file using the countplot() function
# of the seaborn module
# Here we are plotting multiple plots in a single PDF file.
sns.countplot('id', hue='Tax', data= gvn_datafrme)
# Save the plots in a single PDF file by passing some random name to the savefig() function
pplot.savefig('Output.pdf')
Total Code
Approach:
- Import pandas module using the import keyword
- Import pyplot from matplotlib module using the import keyword
- Import seaborn module using the import keyword
- Pass some random CSV file to the read_csv() function of the pandas module to read the given csv file
- Display the first 5 rows of the given csv file using the head() function
- Passing some random plot size(width, length) to the figure() function
- Plot the graph of id, Salary columns in a given CSV file using the countplot() function of the seaborn module
- Plot the subplot by passing the arguments rows, columns and order of the plot to the subplot() function
- Plot the graph of id, Tax columns in a given CSV file using the countplot() function of the seaborn module
- Here we are plotting multiple plots in a single PDF file.
- Save the plots in a single PDF file by passing some random name to the savefig() function.
- The Exit of the Program.
Below is the implementation:
# Import pandas module using the import keyword
import pandas as pd
# Import pyplot from matplotlib module using the import keyword
from matplotlib import pyplot as pplot
# Import seaborn module using the import keyword
import seaborn as sns
# Pass some random CSV file to the read_csv() function of the pandas module
# to read the given csv file
gvn_datafrme = pd.read_csv("demo.csv")
# Display the first 5 rows of the given csv file using the head() function
gvn_datafrme.head()
# Passing some random plot size(width, length) to the figure() function
pplot.figure(figsize=(10, 4))
pplot.subplot(1, 2, 1)
# Plot the graph of id, Salary columns in a given CSV file using the countplot() function
# of the seaborn module
sns.countplot('id', hue='Salary', data= gvn_datafrme)
# Plot the subplot by passing the arguments rows, columns and order of the plot to the
# subplot() function
pplot.subplot(1, 2, 2)
# Plot the graph of id, Tax columns in a given CSV file using the countplot() function
# of the seaborn module
# Here we are plotting multiple plots in a single PDF file.
sns.countplot('id', hue='Tax', data= gvn_datafrme)
# Save the plots in a single PDF file by passing some random name to the savefig() function
pplot.savefig('Output.pdf')
Output: