This post will teach you how to normalize data in Pandas.
Pandas:
Pandas is an open-source library developed on top of the NumPy library. It is a Python module that contains a variety of data structures and procedures for manipulating numerical data and statistics. It’s mostly used to make importing and evaluating data easier. Pandas is fast, high-performance, and productive for users.
Data Normalization:
Data Normalization is a common approach in machine learning that involves translating numeric columns to a standard scale. Some feature values in machine learning differ from others numerous times. The characteristics with the highest values will dominate the learning process.
Before we get into normalisation, let us first grasp why it is necessary.
- Feature scaling is an important stage in data analysis and data preparation for modelling. In this section, we make the data scale-free for easier analysis.
- One of the feature scaling strategies is normalisation. We use normalisation most often when the data is skewed on either axis, i.e. when the data does not match the Gaussian distribution.
- Normalization converts data features from different scales to a similar scale, making it easier to handle the data for modelling. As a result, all of the data features (variables) have a similar impact on the modelling section.
We normalise each feature using the formula below by subtracting the minimum data value from the data variable and then dividing it by the variable’s range, as shown below:
Formula:
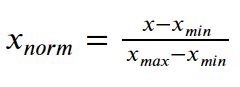
As a result, we convert the data to a range between [0,1].
Methods for Normalizing Data in Python
Python has several approaches that you can use to do normalization.
Let us take an example of a dummy dataset here. You can download some other dataset and test it out.
1) MinMaxScaler
)Importing the Dataset
Import the dataset into a Pandas Dataframe.
# Import pandas module as pd using the import keyword
import pandas as pd
# Import dataset using read_csv() function by pasing the dataset name as
# an argument to it.
# Store it in a variable.
dummy_dataset = pd.read_csv("dummy_data.csv")
print(dummy_dataset)
Output:
    id  calories  protein  fat
0    0        70        4    1
1    1       120        3    5
2    2        70        4    1
3    3        50        4    0
4    4       110        2    2
5    5       110        2    2
6    6       110        2    0
7    7       130        3    2
8    8        90        2    1
9    9        90        3    0
10  10       120        1    2
11  11       110        6    2
12  12       120        1    3
13  13       110        3    2
14  14       110        1    1
15  15       110        2    0
16  16       100        2    0
17  17       110        1    0
18  18       110        1    1
Normalizing the above-given dataset by applying the MinMaxScaler function
Approach:
- Import pandas module as pd using the import keyword.
- Import MinMaxScaler function from sklearn.preprocessing module using the import keyword.
- Import dataset using read_csv() function by pasing the dataset name as an argument to it.
- Store it in a variable.
- Create an object for the MinMaxScaler() function and store it in a variable.
- Normalize(transform the data to 0’s and 1)the given dataset using the fit_transform() function and store it in another variable.
- Print the Normalized data values.
- The Exit of the Program.
Below is the implementation:
# Import pandas module as pd using the import keyword
import pandas as pd
# Import MinMaxScaler function from sklearn.preprocessing module using the import keyword
from sklearn.preprocessing import MinMaxScaler
# Import dataset using read_csv() function by pasing the dataset name as
# an argument to it.
# Store it in a variable.
dummy_dataset = pd.read_csv("dummy_data.csv")
# Create an object for the MinMaxScaler() function and store it in a variable.
scaler_val= MinMaxScaler()

# Normalize(transform the data to 0's and 1)the given dataset using the fit_transform() function and
# store it in another variable.
normalizd_data= pd.DataFrame(scaler_val.fit_transform(dummy_dataset),
            columns=dummy_dataset.columns, index=dummy_dataset.index)
# Print the Normalized data values
print(normalizd_data)
Output:
As can be seen, we have processed and normalised the data values between 0 and 1.
          id  calories  protein  fat
0   0.000000     0.250      0.6  0.2
1   0.055556     0.875      0.4  1.0
2   0.111111     0.250      0.6  0.2
3   0.166667     0.000      0.6  0.0
4   0.222222     0.750      0.2  0.4
5   0.277778     0.750      0.2  0.4
6   0.333333     0.750      0.2  0.0
7   0.388889     1.000      0.4  0.4
8   0.444444     0.500      0.2  0.2
9   0.500000     0.500      0.4  0.0
10  0.555556     0.875      0.0  0.4
11  0.611111     0.750      1.0  0.4
12  0.666667     0.875      0.0  0.6
13  0.722222     0.750      0.4  0.4
14  0.777778     0.750      0.0  0.2
15  0.833333     0.750      0.2  0.0
16  0.888889     0.625      0.2  0.0
17  0.944444     0.750      0.0  0.0
18  1.000000     0.750      0.0  0.2
In Brief:
As a result of the preceding explanation, the following conclusions can be drawn–
- When the data values are skewed normalisation is used and do not follow a gaussian distribution,
- The data values are transformed between 0 and 1.
- Normalization frees the data’s scale.
We can also another method for Normalization i.e;
The maximum absolute scaling:
By dividing each observation by its maximum absolute value, maximum absolute scaling rescales each feature between -1 and 1. Using the.max() and.abs() methods in Pandas, we may achieve maximum absolute scaling.
But, the MinMaxScaler function is the popular one. Hence we have gone through only this in this article.