Mayank Gupta

How to Append Text or Lines to a File in Python

In this article, we will discuss the topic of how to append in a python file.

Before we fully understand this topic we have to be clear about some basic abbreviations that we use during file handling in python whether we have to write something to the file or append to the file.

There are some modes in python that we need when we work with python files.

These modes are:-

  1. Read Mode (‘r’)-This is the default mode. This mode opens a file for reading and gives an error if the file doesn’t exist.
  2. Append mode (‘a’)- This mode is used to append to a file in python. If no file exists it creates a new file.
  3. Write mode (‘w’)- This mode is used to write to a file in python. If no file exists it creates a new file.
  4. “r+”: This mode is used for both reading and writing.
  5. “a+”: This mode is used for both reading and appending.

Difference between writing and appending in a file

So some may have a sort of confusion about what is the difference between appending and writing to a file. The basic difference between both of them is that when we open a file in write mode then as many as the time we perform write operation our original data will be overwritten with new data but when we access the file in append mode it means we append new data with original data.

open() function and its working

 As we know to perform any operation in a file first we have to access it.Here open() function comes into use.the open() function is used to open a file in reading or write or append mode. As our main concern in this topic is to discuss append data so we use append mode with the open() function.

the open() function takes two arguments first is the file name and another is the mode in which we want to access the file. If we do not pass any mode it will by default take ‘r’ mode.

So the syntax is open(fileName,mode).

To open files in append mode we use either ‘a’ mode or ‘a+’ mode. With file access mode ‘a’ open() function first checks if a file exists or not. If a file doesn’t exist it creates a file and then opens it otherwise it directly opens the file. In both cases, a file object is returned.

Syntax: file_object=open(fileName,’a’). Or file_object=open(fileName,’a+’).

Here we can use any variable name. “file_object” is not a compulsion. In file_object a file object is returned which is helpful to perform append operation in the file.

File Object

Here we see a word file object multiple times so let’s understand what file object actually means. The file object is the connector between us and the file. It allows us to read and write in the file. It takes a reference of the file and opens it in the different mode we want.

Example:

Input

f=open("append_file.txt", "a")
f.write("First Line\n")
f.write("Second Line")
f.close()

Output

First Line

Second Line

Note: \n is used to append data to a new line otherwise our content will look like this…

Output without using “\n” is given below

First LineSecond Line

Code Explanation

We opened the file ‘append_file.txt’ in append mode i.e. using access mode ‘a’. As the cursor was pointing to the end of the file in the file object, therefore when we passed the string in the write() function, it appended it at the end of the file. So, our text ‘Second  Line’ gets added at the end of the file ‘append_file.txt’.

 Append Data to a new line in python files

In the previous example, we see that we use escape sequence ‘\n’ to append data in a new line. This method is good but it will fail in one scenario. When a file does not exist or is empty then this approach will create a problem. Hence we should change this approach and work on a new approach that will work on all the cases.

Before understanding the new approach we must need to know about some abbreviations and functions.

  • Read() function: The read() method returns the specified number of bytes from the file. Default is -1 which means the whole file.

For Example, if we write f.read(30) so it will read() first 30 characters from the file.

  • seek() method: The seek() method sets the file’s current position at the offset. The whence argument is optional and defaults to 0, which means absolute file positioning, other values are 1 which means seek relative to the current position and 2 means seek relative to the file’s end.

Note: If the file is only opened for writing in append mode using ‘a’, this method is essentially a no-op, but it remains useful for files opened in append mode with reading enabled (mode ‘a+’).

As we understand two important concepts now we will be comfortable in implementing the new approach to append data in a new line in the file.

Approach

  • Open the file in append & read mode (‘a+’). Both read & write cursor points to the end of the file.
  • Move the red cursor to the start of the file.
  • Read some text from the file and check if the file is empty or not.
  • If the file is not empty, then append ‘\n’ at the end of the file using the write() function.
  • Append a given line to the file using the write() function.
  • Close the file

As we check whether our file is empty or not so it will work on all the scenarios.

Examples
Input

f=open("append_file.txt", "a+")
f.seek(0)
data = f.read(100)
if len(data) > 0 :
    f.write("\n")
f.write("second line")

Output

Hello Nice meeting you
second line

Before appending the string “second line” in the file my file has the content “Hello Nice meeting you” so it will append the second line” in the new line.

Use of with open statement to append text in the python file

With open() do similar functions as open() do but one difference is that we do not need to close files. with open() statement handles it.

Example

With open(file,a) as f is similar as f=open(file,a)

Input

with open("append_file.txt","a") as f:
    f.write("First Line\n")
    f.write("Second Line")

Output

First Line

Second Line

We clearly see that the output is the same as the previous one.

Appending List of items in the python file

Till now we see that we can append text in a file with help of the write() function. But consider a scenario where we have a list of items instead of string then what we can do. One of the traditional ways is that we can run a loop and append data. But there is also another way in which we can append a list of items in a single line without using a loop. We can do this by using writelines() method.

Example

Input

l=['I ','use ','writelines()','function']
f=open("append_file.txt", "a")
f.write("First Line\n")
f.write("second line\n")
f.writelines(l)

Output

First Line
second line
I use writelines()function

Here we see that we have a list l and we easily append items of the list in the file without using any loop.

Python: Check if a Value Exists in the Dictionary

In this article, we will be discussing how to check if a value exists in the python dictionary or not.

Before going to the different method to check let take a quick view of python dictionary and some of its basic function that we will be used in different methods.

Dictionary in python is an unordered collection of elements. Each element consists of key-value pair.It must be noted that keys in dictionary must be unique because if keys will not unique we might get different values in the same keys which is wrong. There is no such restriction in the case of values.

For example: {“a”:1, “b”:2, “c”:3, “d”,4}

Here a,b,c, and d are keys, and 1,2,3, and 4 are values.

Now let take a quick look at some basic method that we are going to use.

  1. keys():  The keys() method in Python Dictionary, return a list of keys that are present in a particular dictionary.
  2. values(): The values() method in Python Dictionary, return a list of values that are present in a particular dictionary.
  3. items(): The items() method in python dictionary return a list of key-value pair.

syntax for using keys() method: dictionary_name.keys()

syntax for using values() method: dictionary_name.values()

syntax for using items() method: dictionary_name.items()

Let us understand this with basic code

d={"a":1,
    "b":2,
    "c":3,
    "d":4
    }
print(type(d))
print(d.keys())
print(d.values())
print(d.items())

Output

<class 'dict'>
dict_keys(['a', 'b', 'c', 'd'])
dict_values([1, 2, 3, 4])
dict_items([('a', 1), ('b', 2), ('c', 3), ('d', 4)])

Here we see that d is our dictionary and has a,b,c, and d as keys and 1,2,3,4 as values and items() return a tuple of key-value pair.

Different methods to check if a value exists in the dictionary

  • Using in operator and values()

    As we see values() method gives us a list of values in the python dictionary and in keyword is used to check if a value is present in a sequence (list, range, string, etc.).So by using the combination of both in operator and values() method we can easily check if a value exists in the dictionary or not. This method will return boolean values i.e. True or False. True if we get the value otherwise False.

d={"a":1,
    "b":2,
    "c":3,
    "d":4
    }
print(3 in d.values())
if(3 in d.values()):
    print("3 is present in dictionary")
else:
    print("3 is not present in dictionary")

Output

True
3 is present in dictionary
  • Using for loop

Here we can use for loop in different ways to check if a value exists in the dictionary or not. One of the methods is to iterate over the dictionary and check for each key if our value is matching or not using a conditional statement(if-else). And another method is that we can iterate over all the key-value pairs of dictionary using a for loop and while iteration we can check if our value matches any value in the key-value pairs.

Let us see both the method one by one.

First method

d={"a":1,
    "b":2,
    "c":3,
    "d":4
    }
res = False
for key in d:
    if(d[key] == 3):
        res = True 
        break
if(res):
     print("3 is present in dictionary")
else:
     print("3 is not present in dictionary")

Output

3 is present in dictionary

Here we iterate over the dictionary and check for each key if our value is matching or not using a conditional statement(if-else).

Second Method

d={"a":1,
    "b":2,
    "c":3,
    "d":4
    }
res = False
value=3
for key, val in d.items():
    if val == value:
        res = True
        break
if(res):
    print(f"{value} is present in dictionary")
else:
    print(f"{value} is not present in dictionary")

Output

3 is present in dictionary

Here we can iterate over all the key-value pairs of dictionary using a for loop and while iteration we can check if our value matches any value in the key-value pairs.

  • Using any() and List comprehension

Using list comprehension, iterate over a sequence of all the key-value pairs in the dictionary and create a bool list. The list will contain a True for each occurrence of our value in the dictionary. Then call any() function on the list of bools to check if it contains any True. any() function accept list, tuples, or dictionary as an argument. If yes then it means that our value exists in any key-value pair of the dictionary otherwise not.

d={"a":1,
    "b":2,
    "c":3,
    "d":4
    }
value=3
if any([True for k,v in d.items() if v == value]):
    print(f"Yes, Value: '{value}' exists in dictionary")
else:
    print(f"No, Value: '{value}' does not exists in dictionary")

Output

Yes, Value: '3' exists in dictionary

So these are the different methods to check if a value exists in the dictionary or not.

How to Convert a List to Dictionary in Python?

In this article, we will discuss the topic of how to convert a list to the dictionary in python. Before going to the actual topic let us take a quick brief of lists and dictionaries in python.

List: In python, a list is used to store the item of various data types like integer, float, string, etc. Python list is mutable i.e we can update the python list or simply say we can modify its element after its creation.

l=[1,"a","b",2,3,3.1]
print(type(l))

Output

<class 'list'>

Dictionary: Dictionary is an unordered collection of data values that are used to store data in the form of key-value pairs.

d={"a":1,
    "b":2,
    "c":3,
    "d":4
    }

print(type(d))

Output

<class 'dict'>

Important Point:

A list is an ordered collection of data while a dictionary is an unordered collection of data so when we convert the list into dictionary output, may differ in order.

Ways to convert list to the dictionary in python

  • Method1-Using dictionary comprehension

This is one of the ways to convert a list to a dictionary in python. Let us understand what dictionary comprehension is. Dictionary comprehension is one of the easiest ways to create a dictionary. Using Dictionary comprehension we can make our dictionary by writing only a single line of code.

syntax: d = {key: value for variables in iterable}

Example :- d={ i: i*2 for i in range(1,6)}

d={i : i*2 for i in range(1,6)}
print(d)

Output

{1: 2, 2: 4, 3: 6, 4: 8, 5: 10}

Let us understand with an example how we can convert a list to a dictionary using this method. We clearly see in a dictionary comprehension syntax we iterate iterables and we know the list is also iterable so we simply iterate our list and form a dictionary with the list. Let us clear this concept with an example:-

l=[1,2,3,4,5]
d={i : i*2 for i in l}
print(d)

Output

{1: 2, 2: 4, 3: 6, 4: 8, 5: 10}

Explanation: We simply pass a list in the dictionary comprehension and iterate through each element of the list. The element we get is store in i and we successfully executed the condition “i : i*2” to get the key-value pair.

  • Method-2 Using zip() function

The zip() function is used to aggregate or zip or combine the two values together. zip() function returns a zip object so we can easily convert this zip object to the tuple, list, or dictionary.

syntax:  zip(iterator1,iterator2,…….)

As we convert the list to the dictionary so we need only two iterators and these are lists. That means we pass a list as an argument in the zip() function we get a zip object and then we can typecast this zip object to the dictionary. But here 2 cases will arise the first case when both lists have the same length second case when both lists have different lengths. Let us see both cases one by one.

First case: When both the list are of the same length

l1=['a','b','c','d']
l2=[1,2,3,4]
zip_val=zip(l1,l2)
print(zip_val)
print(dict(zip_val))

Output

<zip object at 0x00000142497361C8>
{'a': 1, 'b': 2, 'c': 3, 'd': 4}

Explanation: Here we see that both the list are of the same length. We can see that the first zip() function returns a zip object that we print in the above example and then we typecast this object into the dictionary to get the desired result.

Second case: When both the list are of the different length

l1=['a','b','c','d','e']
l2=[1,2,3,4]
zip_val=zip(l1,l2)
print(zip_val)
print(dict(zip_val))

Output

<zip object at 0x000001C331F160C8>
{'a': 1, 'b': 2, 'c': 3, 'd': 4}

Explanation: Here we see that our first list is of length 5 while the second list is of length 4 and in the final result, we get only 4 key-value pairs. So it can be concluded that the list with the smallest length will decide the number of key-value pairs in output. While another part is the same i.e. first we get a zip object and we typecast this zip object into the dictionary to get our desired result.

  • Method-3 Using dict() constructor

dict() constructor is also used to create a dictionary in python.This method comes into use when we have list of tuples. List of tuples means tuples inside the list.

Example: listofTuples = [(“student1” , 1), (“student2” , 2), (“Student3” , 3)] is a list of tuples.

listofTuples = [("student1" , 1), ("student2" , 2), ("Student3" , 3)]
print(dict(listofTuples))

Output

{'student1': 1, 'student2': 2, 'Student3': 3}

so these are the three methods to convert a list to the dictionary in python.


Append Add Row to Dataframe in Pandas

Append/Add Row to Dataframe in Pandas – dataframe.append() | How to Insert Rows to Pandas Dataframe?

Worried about how to append or add rows to a dataframe in Pandas? Then, this tutorial will guide you completely on how to append rows to a dataframe in Pandas Python using the function dataframe.append() We have listed the various methods for appending rows to a dataframe. In this tutorial, we will discuss how to append or add rows to the dataframe in Pandas. Before going to the main concept let us discuss some basic concepts about pandas and Dataframes.

Pandas – Definition

Pandas is a package in python that is used to analyze data in a very easy way. The reason why pandas are so famous is that it is very easy to use. But we can not directly use the pandas’ package in our program. To use this package first we have to import it.

Dataframe – Definition

Dataframe is a 2D data structure that store or represent the data in the 2D form or simply say in tabular form. The tabular form consists of rows, columns, and actual data. By using pandas we can manipulate the data as we want i.e we can see as many columns as we want or as many rows as we want. We can group the data or filter the data.

Let us understand both dataframe and pandas with an easy example

import pandas as pd
d={"Name":["Mayank","Raj","Rahul","Samar"],
   "Marks":[90,88,97,78]
  }
df=pd.DataFrame(d)
print(df)

Output

    Name  Marks
0  Mayank     90
1     Raj     88
2   Rahul     97
3   Samar     78

Here we see that first, we import our pandas package then we create a dictionary, and out of this dictionary, we create our dataframe. When we see our dataframe we see that it consists of rows and columns and data. There are many ways to create a dataframe like importing excel or CSV files or through a dictionary but this is not the main concern of this article.

Before understanding the concept of appending rows to a dataframe first we have to know a little bit about the append() method.

append() method

append() method is used to append rows of other dataframe at the end of the original or given dataframe. It returns a new dataframe object. If some columns are not presented in the original dataframe but presented in a new dataframe then-new column will also be added in the dataframe and data of that column will become NAN.
Syntax: DataFrame.append(other, ignore_index=False, verify_integrity=False, sort=None)

Ways on Pandas append row to Dataframe

Method 1- How to Add dictionary as a row to dataframe

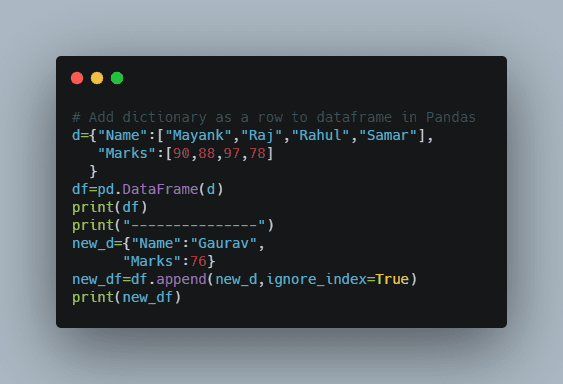
In this method, we see how we can append dictionaries as rows in pandas dataframe. It is a pretty simple way. We have to pass a dictionary in the append() method and our work is done. That dictionary is passed as an argument to other the parameter in the append method. Let us see this with an example.

Add dictionary as a row to dataframe in Pandas

d={"Name":["Mayank","Raj","Rahul","Samar"],
   "Marks":[90,88,97,78]
  }
df=pd.DataFrame(d)
print(df)
print("---------------")
new_d={"Name":"Gaurav",
      "Marks":76}
new_df=df.append(new_d,ignore_index=True)
print(new_df)

Output:

     Name  Marks
0  Mayank     90
1     Raj     88
2   Rahul     97
3   Samar     78
---------------
     Name  Marks
0  Mayank     90
1     Raj     88
2   Rahul     97
3   Samar     78
4  Gaurav     76
Explanation:
In this example, we see how we can append a dictionary in our original dataframe. By this method, our original dataframe will not affect that why we store the new Dataframe in a new variable so that we can analyze the changes.
Instead of assigning it to a new variable, we can assign it to the original dataframe in this case our original dataframe gets modify. It means that the append() method is not inplace.
Note: Passing ignore_index=True is necessary while passing dictionary or series otherwise a TypeError error will come.

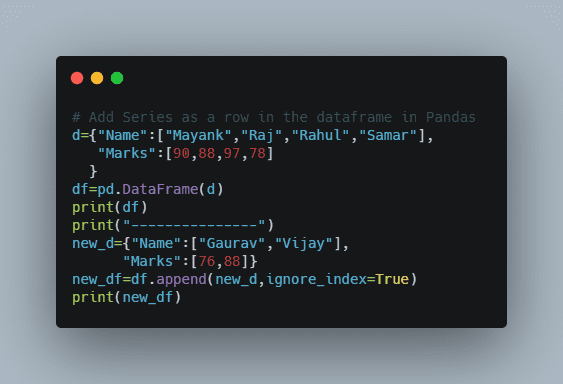
Method 2 – Add Series as a row in the dataframe

This is another method to append rows in the dataframe. Let us see why this method is needed.

Add Series as a row in the dataframe in Pandas

d={"Name":["Mayank","Raj","Rahul","Samar"],
   "Marks":[90,88,97,78]
  }
df=pd.DataFrame(d)
print(df)
print("---------------")
new_d={"Name":["Gaurav","Vijay"],
      "Marks":[76,88]}
new_df=df.append(new_d,ignore_index=True)
print(new_df)

Output:

    Name  Marks
0  Mayank     90
1     Raj     88
2   Rahul     97
3   Samar     78
---------------
              Name     Marks
0           Mayank        90
1              Raj        88
2            Rahul        97
3            Samar        78
4  [Gaurav, Vijay]  [76, 88]

If we want to add multiple rows at one time and we try it using a dictionary then we get output like this then we get the output as shown above.

To solve this issue we use series. Let us understand what series means.

Series

Series is a 1-D array that stores a single column or row of data in a dataframe.

syntax: pandas.Series( data, index, dtype, copy)

series=pd.Series(['Ajay','Vijay'])
print(series)
print(type(series))

Output

0     Ajay
1    Vijay
dtype: object
<class 'pandas.core.series.Series'>

That is how we can create a series in pandas. Now we see how we can append series in pandas dataframe. It is similar like as we pass our dictionary. We can simply pass series as an argument in the append() function. Let see this with an example.

d={"Name":["Mayank","Raj","Rahul","Samar"],
   "Marks":[90,88,97,78]
  }
df=pd.DataFrame(d)
print(df)
print("---------------")
series=[pd.Series(['Gaurav',88], index=df.columns ) ,
        pd.Series(['Vijay', 99], index=df.columns )]
new_df=df.append(series,ignore_index=True)
print(new_df)

Output:

     Name  Marks
0  Mayank     90
1     Raj     88
2   Rahul     97
3   Samar     78
---------------
     Name  Marks
0  Mayank     90
1     Raj     88
2   Rahul     97
3   Samar     78
4  Gaurav     88
5   Vijay     99

We see that by this method we solve the problem to add multiple rows at a time that we face in the dictionary.

Method 3 – How to Add row from one dataframe to another dataframe

To understand this method first we have to understand about concepts of loc.

loc[ ]

It is used to access groups of rows and columns by values. Let us understand this concept with help of an example.

students = [ ('Mayank',98) ,
             ('Raj', 75) ,
             ('Rahul', 87) ,
             ('Samar', 78)]
df = pd.DataFrame(  students, 
                    columns = ['Name' , 'Marks'],
                    index=['a', 'b', 'c' , 'd']) 
print(df)
print("------------------")
# If we want only row 'c' and all columns
print(df.loc[['c'],:])
print("------------------")
# If we want only row 'c' and only column 'Name'
print(df.loc['c']['Name'])
print("------------------")
# If we want only row 'c' and 'd' and all columns
print(df.loc[['c','d'],:])
print("------------------")
# If we want only row 'c' and 'd' and only column 'Name'
print(df.loc[['c','d'],['Name']])
print("------------------")

Output:

     Name  Marks
a  Mayank     98
b     Raj     75
c   Rahul     87
d   Samar     78
------------------
    Name  Marks
c  Rahul     87
------------------
Rahul
------------------
    Name  Marks
c  Rahul     87
d  Samar     78
------------------
    Name
c  Rahul
d  Samar
------------------

This example is very helpful to understand how loc works in pandas.

Now it can be very easy to understand how we can add rows of one dataframe to another dataframe. Let us see this with an example.

students1 = [ ('Mayank',98) ,
             ('Raj', 75) ,
             ('Rahul', 87) ,
             ('Samar', 78)]
df1 = pd.DataFrame(  students, 
                    columns = ['Name' , 'Marks'],
                    index=['a', 'b', 'c' , 'd']) 
print(df1)
print("------------------")
students2 = [ ('Vijay',94) ,
             ('Sunil', 76),
             ('Sanjay', 80)
            ]
df2= pd.DataFrame(  students2, 
                    columns = ['Name' , 'Marks'],
                    index=['a', 'b','c']) 
print(df2)

print("------------------")
new_df=df1.append(df2.loc[['a','c'],:],ignore_index=True)
print(new_df)

Output:

     Name  Marks
a  Mayank     98
b     Raj     75
c   Rahul     87
d   Samar     78
------------------
     Name  Marks
a   Vijay     94
b   Sunil     76
c  Sanjay     80
------------------
     Name  Marks
0  Mayank     98
1     Raj     75
2   Rahul     87
3   Samar     78
4   Vijay     94
5  Sanjay     80

In this example, we see how we easily append rows ‘a’ and ‘c’ of df2 in df1.

Method 4 – How to Add a row in the dataframe at index position using iloc[]

iloc[]

iloc[] in pandas allows us to retrieve a particular value belonging to a row and column using the index values assigned to it. IT will raise Index errors if a requested indexer is out-of-bounds.

students1 = [ ('Mayank',98) ,
             ('Raj', 75) ,
             ('Rahul', 87) ,
             ('Samar', 78)]
df1 = pd.DataFrame(  students, 
                    columns = ['Name' , 'Marks'],
                    index=['a', 'b', 'c' , 'd']) 
print(df1.iloc[0])

Output

Name     Mayank
Marks        98
Name: a, dtype: object

This example shows how we can access any row using an index.

Note: We use the index in iloc and not the column name.

Now let us see how we can append row in dataframe using iloc

students1 = [ ('Mayank',98) ,
('Raj', 75) ,
('Rahul', 87) ,
('Samar', 78)]
df1 = pd.DataFrame( students, 
columns = ['Name' , 'Marks'],
index=['a', 'b', 'c' , 'd']) 
print("Original dataframe")
print(df1)
print("------------------")
df1.iloc[2] = ['Vijay', 80]
print("New dataframe")
print(df1)

Output:

Original dataframe
     Name  Marks
a  Mayank     98
b     Raj     75
c   Rahul     87
d   Samar     78
------------------
New dataframe
     Name  Marks
a  Mayank     98
b     Raj     75
c   Vijay     80
d   Samar     78

This example shows how we add a column in the dataframe at a specific index using iloc.

So these are the methods to add or append rows in the dataframe.

Want to expert in the python programming language? Exploring Python Data Analysis using Pandas tutorial changes your knowledge from basic to advance level in python concepts.

Read more Articles on Python Data Analysis Using Padas – Add Contents to a Dataframe

Pandas Drop Rows With NaNMissing Values in any or Selected Columns of Dataframe

Pandas: Drop Rows With NaN/Missing Values in any or Selected Columns of Dataframe

Pandas provide several data structures and operations to manipulate data and time series. There might be instances in which some data can go missing and pandas use two values to denote the missing data namely None, NaN. You will come across what does None and Nan indicate. In this tutorial we will discuss the dropna() function, why is it necessary to remove rows which contain missing values or NaN, and different methods to drop rows with NaN or Missing values in any or selected column in the dataframe.

dropna() function

The dropna() function is used to analyze and drop rows or columns having NaN or missing values in different ways.

syntax:  DataFrameName.dropna(axis, how, thresh, subset, inplace)

Parameters:

1) axis: If the axis is 0 rows with missing or NaN values will be dropped else if axis=1 columns with NaN or missing values will be dropped.

2) how: how to take a string as a parameter ‘any’ or ‘all’.  ‘any’ is used if any NaN value is present otherwise ‘all’ is used if all values are NaN.

3) thresh: It tells the minimum amount of NaN values that is to be dropped.

4) inplace: If inplace is true chance will be made in the existing dataset otherwise changes will be made in different datasets.

The Necessity to remove NaN or Missing values

NaN stands for Not a Number. It is used to signify whether a particular cell contains any data or not. When we work on different datasets we found that there are some cells that may have NaN or missing values. If we work on that type of dataset then the chances are high that we do not get an accurate result. Hence while working on any dataset we check whether our datasets contain any missing values or not. If it contains NaN values we will remove it so as to get results with more accuracy.

How to drop rows of Pandas DataFrame whose value in a certain column is NaN or a Missing Value?

There are different methods to drop rows of Pandas Dataframe whose value is missing or Nan. All 4 methods are explained with enough examples so that you can better understand the concept and apply the conceptual knowledge to other programs on your own.

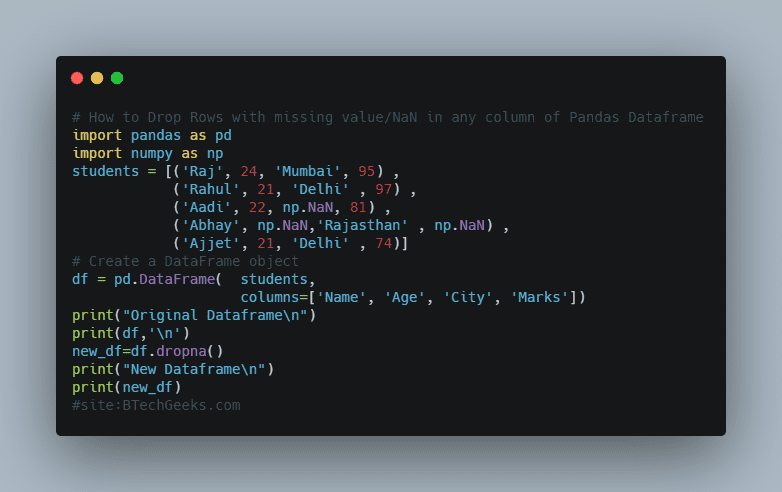
Method 1: Drop Rows with missing value / NaN in any column

In this method, we will see how to drop rows with missing or NaN values in any column. As we know in all our methods dropna() function is going to be used hence we have to play with parameters. By default value of the axis is 0 and how is ‘any’ hence dropna() function without any parameter will going to be used to drop rows with missing or NaN values in any column. Let see this with the help of an example.

import pandas as pd
import numpy as np
students = [('Raj', 24, 'Mumbai', 95) ,
            ('Rahul', 21, 'Delhi' , 97) ,
            ('Aadi', 22, np.NaN, 81) ,
            ('Abhay', np.NaN,'Rajasthan' , np.NaN) ,
            ('Ajjet', 21, 'Delhi' , 74)]
# Create a DataFrame object
df = pd.DataFrame(  students, 
                    columns=['Name', 'Age', 'City', 'Marks'])
print("Original Dataframe\n")
print(df,'\n')
new_df=df.dropna()
print("New Dataframe\n")
print(new_df)

How to Drop Rows with missing valueNaN in any column of Pandas Dataframe

Output

Original Dataframe

    Name   Age       City  Marks
0    Raj  24.0     Mumbai   95.0
1  Rahul  21.0      Delhi   97.0
2   Aadi  22.0        NaN   81.0
3  Abhay   NaN  Rajasthan    NaN
4  Ajjet  21.0      Delhi   74.0 

New Dataframe

    Name   Age    City  Marks
0    Raj  24.0  Mumbai   95.0
1  Rahul  21.0   Delhi   97.0
4  Ajjet  21.0   Delhi   74.0

Here we see that we get only those rows that don’t have any NaN or missing value.

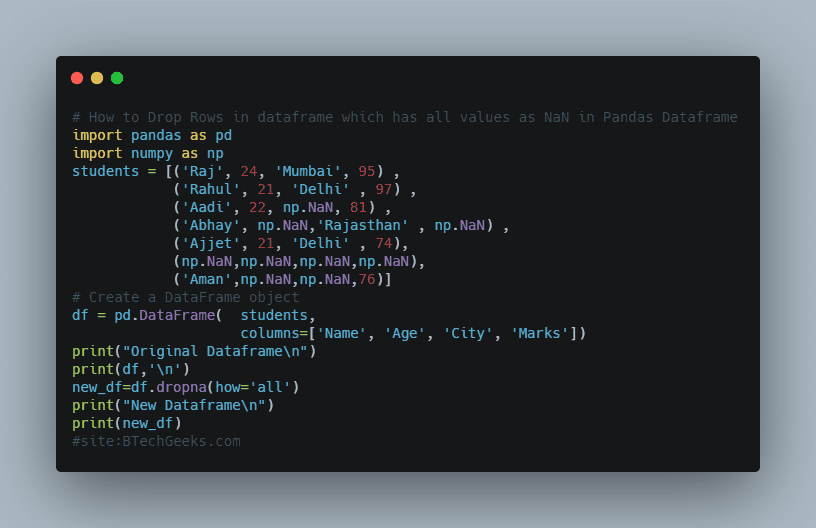
Method 2: Drop Rows in dataframe which has all values as NaN

In this method, we have to drop only those rows in which all the values are NaN or missing. Hence we have to only pass how as an argument with value ‘all’ and all the parameters work with their default values. Let see this with an example.

import pandas as pd
import numpy as np
students = [('Raj', 24, 'Mumbai', 95) ,
            ('Rahul', 21, 'Delhi' , 97) ,
            ('Aadi', 22, np.NaN, 81) ,
            ('Abhay', np.NaN,'Rajasthan' , np.NaN) ,
            ('Ajjet', 21, 'Delhi' , 74),
            (np.NaN,np.NaN,np.NaN,np.NaN),
            ('Aman',np.NaN,np.NaN,76)]
# Create a DataFrame object
df = pd.DataFrame(  students, 
                    columns=['Name', 'Age', 'City', 'Marks'])
print("Original Dataframe\n")
print(df,'\n')
new_df=df.dropna(how='all')
print("New Dataframe\n")
print(new_df)


How to Drop Rows in dataframe which has all values as NaN in Pandas Dataframe

Output

Original Dataframe

    Name   Age       City  Marks
0    Raj  24.0     Mumbai   95.0
1  Rahul  21.0      Delhi   97.0
2   Aadi  22.0        NaN   81.0
3  Abhay   NaN  Rajasthan    NaN
4  Ajjet  21.0      Delhi   74.0
5    NaN   NaN        NaN    NaN
6   Aman   NaN        NaN   76.0 

New Dataframe

    Name   Age       City  Marks
0    Raj  24.0     Mumbai   95.0
1  Rahul  21.0      Delhi   97.0
2   Aadi  22.0        NaN   81.0
3  Abhay   NaN  Rajasthan    NaN
4  Ajjet  21.0      Delhi   74.0
6   Aman   NaN        NaN   76.0

Here we see that row 5 is dropped because it has all the values as NaN.

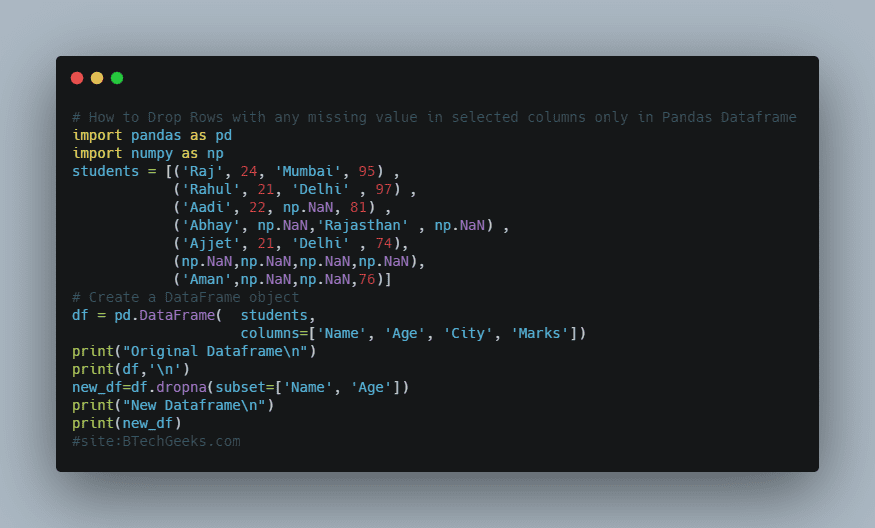
Method 3: Drop Rows with any missing value in selected columns only

In this method, we see how to drop rows with any of the NaN values in the selected column only. Here also axis and how to take default value but we have to give a list of columns in the subset in which we want to perform our operation. Let see this with the help of an example.

import pandas as pd
import numpy as np
students = [('Raj', 24, 'Mumbai', 95) ,
            ('Rahul', 21, 'Delhi' , 97) ,
            ('Aadi', 22, np.NaN, 81) ,
            ('Abhay', np.NaN,'Rajasthan' , np.NaN) ,
            ('Ajjet', 21, 'Delhi' , 74),
            (np.NaN,np.NaN,np.NaN,np.NaN),
            ('Aman',np.NaN,np.NaN,76)]
# Create a DataFrame object
df = pd.DataFrame(  students, 
                    columns=['Name', 'Age', 'City', 'Marks'])
print("Original Dataframe\n")
print(df,'\n')
new_df=df.dropna(subset=['Name', 'Age'])
print("New Dataframe\n")
print(new_df)

How to Drop Rows with any missing value in selected columns only in Pandas Dataframe

Output

Original Dataframe

    Name   Age       City  Marks
0    Raj  24.0     Mumbai   95.0
1  Rahul  21.0      Delhi   97.0
2   Aadi  22.0        NaN   81.0
3  Abhay   NaN  Rajasthan    NaN
4  Ajjet  21.0      Delhi   74.0
5    NaN   NaN        NaN    NaN
6   Aman   NaN        NaN   76.0 

New Dataframe

    Name   Age    City  Marks
0    Raj  24.0  Mumbai   95.0
1  Rahul  21.0   Delhi   97.0
2   Aadi  22.0     NaN   81.0
4  Ajjet  21.0   Delhi   74.0

Here we see in rows 3,5 and 6 columns ‘Name’ and ‘Age’ has NaN or missing values so these columns are dropped.

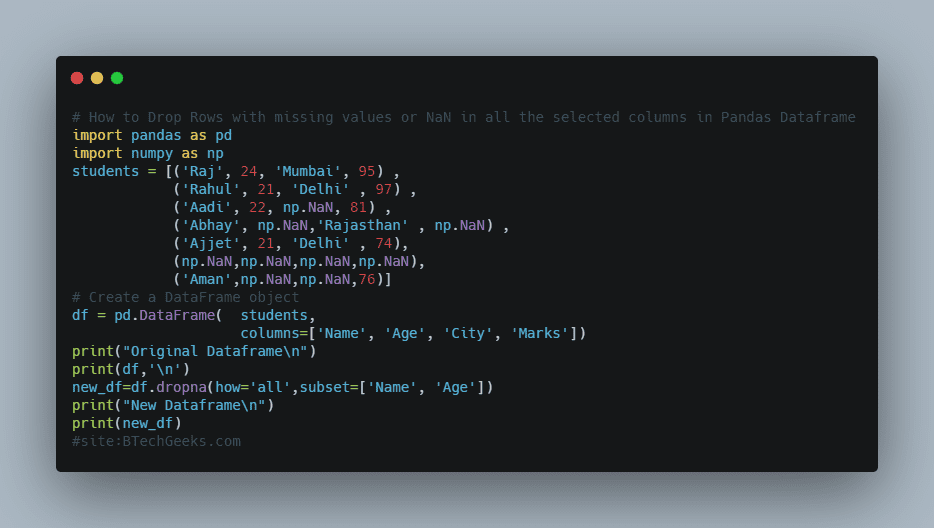
Method 4: Drop Rows with missing values or NaN in all the selected columns

In this method we see how to drop rows that have all the values as NaN or missing values in a select column i.e if we select two columns ‘A’ and ‘B’ then both columns must have missing values. Here we have to pass a list of columns in the subset and ‘all’ in how. Let see this with the help of an example.

import pandas as pd
import numpy as np
students = [('Raj', 24, 'Mumbai', 95) ,
            ('Rahul', 21, 'Delhi' , 97) ,
            ('Aadi', 22, np.NaN, 81) ,
            ('Abhay', np.NaN,'Rajasthan' , np.NaN) ,
            ('Ajjet', 21, 'Delhi' , 74),
            (np.NaN,np.NaN,np.NaN,np.NaN),
            ('Aman',np.NaN,np.NaN,76)]
# Create a DataFrame object
df = pd.DataFrame(  students, 
                    columns=['Name', 'Age', 'City', 'Marks'])
print("Original Dataframe\n")
print(df,'\n')
new_df=df.dropna(how='all',subset=['Name', 'Age'])
print("New Dataframe\n")
print(new_df)

How to Drop Rows with missing values or NaN in all the selected columns in Pandas Dataframe

Output

Original Dataframe

    Name   Age       City  Marks
0    Raj  24.0     Mumbai   95.0
1  Rahul  21.0      Delhi   97.0
2   Aadi  22.0        NaN   81.0
3  Abhay   NaN  Rajasthan    NaN
4  Ajjet  21.0      Delhi   74.0
5    NaN   NaN        NaN    NaN
6   Aman   NaN        NaN   76.0 

New Dataframe

    Name   Age       City  Marks
0    Raj  24.0     Mumbai   95.0
1  Rahul  21.0      Delhi   97.0
2   Aadi  22.0        NaN   81.0
3  Abhay   NaN  Rajasthan    NaN
4  Ajjet  21.0      Delhi   74.0
6   Aman   NaN        NaN   76.0

Here we see that only row 7 has NaN value in both the columns hence it is dropped, while row 3 and row 6 have NaN value only in the age column hence it is not dropped.

So these are the methods to drop rows having all values as NaN or selected value as NaN.

Want to expert in the python programming language? Exploring Python Data Analysis using Pandas tutorial changes your knowledge from basic to advance level in python concepts.

Read more Articles on Python Data Analysis Using Pandas – Remove Contents from a Dataframe

Pandas: Add Two Columns into a New Column in Dataframe

Methods to add two columns into a new column in Dataframe

In this article, we discuss how to add to column to an existing column in the dataframe and how to add two columns to make a new column in the dataframe using pandas. We will also discuss how to deal with NaN values.

  • Method 1-Sum two columns together to make a new series

In this method, we simply select two-column by their column name and then simply add them.Let see this with the help of an example.

import pandas as pd 
import numpy as np 
students = [('Raj', 24, 'Mumbai', 95) , 
            ('Rahul', 21, 'Delhi' , 97) , 
            ('Aadi', 22, np.NaN, 81) , 
            ('Abhay', 25,'Rajasthan' , 90) , 
            ('Ajjet', 21, 'Delhi' , 74)] 
# Create a DataFrame object 
df = pd.DataFrame( students, columns=['Name', 'Age', 'City', 'Marks']) 
print("Original Dataframe\n") 
print(df,'\n') 
total = df['Age'] + df['Marks']
print("New Series \n") 
print(total)
print(type(total))

Output

Original Dataframe

    Name  Age       City  Marks
0    Raj   24     Mumbai     95
1  Rahul   21      Delhi     97
2   Aadi   22        NaN     81
3  Abhay   25  Rajasthan     90
4  Ajjet   21      Delhi     74 

New Series 

0    119
1    118
2    103
3    115
4     95
dtype: int64
<class 'pandas.core.series.Series'>

Here we see that when we add two columns then a series will be formed.]

Note: We can’t add a string with int or float. We can only add a string with a string or a number with a number.

Let see the example of adding string with string.

import pandas as pd 
import numpy as np 
students = [('Raj', 24, 'Mumbai', 95) , 
            ('Rahul', 21, 'Delhi' , 97) , 
            ('Aadi', 22, 'Kolkata', 81) , 
            ('Abhay', 25,'Rajasthan' , 90) , 
            ('Ajjet', 21, 'Delhi' , 74)] 
# Create a DataFrame object 
df = pd.DataFrame( students, columns=['Name', 'Age', 'City', 'Marks']) 
print("Original Dataframe\n") 
print(df,'\n') 
total = df['Name'] + " "+df['City']
print("New Series \n") 
print(total)
print(type(total))

Output

Original Dataframe

    Name  Age       City  Marks
0    Raj   24     Mumbai     95
1  Rahul   21      Delhi     97
2   Aadi   22    Kolkata     81
3  Abhay   25  Rajasthan     90
4  Ajjet   21      Delhi     74 

New Series 

0         Raj Mumbai
1        Rahul Delhi
2       Aadi Kolkata
3    Abhay Rajasthan
4        Ajjet Delhi
dtype: object
<class 'pandas.core.series.Series'>
  • Method 2-Sum two columns together having NaN values to make a new series

In the previous method, there is no NaN or missing values but in this case, we also have NaN values. So when we add two columns in which one or two-column contains NaN values then we will see that we also get the result as NaN. Let see this with the help of an example.

import pandas as pd 
import numpy as np 
students = [('Raj', 24, 'Mumbai', 95) , 
            ('Rahul', 21, 'Delhi' , 97) , 
            ('Aadi', 22, 'Kolkata', np.NaN) , 
            ('Abhay', np.NaN,'Rajasthan' , 90) , 
            ('Ajjet', 21, 'Delhi' , 74)] 
# Create a DataFrame object 
df = pd.DataFrame( students, columns=['Name', 'Age', 'City', 'Marks']) 
print("Original Dataframe\n") 
print(df,'\n') 
total = df['Marks'] + df['Age']
print("New Series \n") 
print(total)
print(type(total))

Output

Original Dataframe

    Name   Age       City  Marks
0    Raj  24.0     Mumbai   95.0
1  Rahul  21.0      Delhi   97.0
2   Aadi  22.0    Kolkata    NaN
3  Abhay   NaN  Rajasthan   90.0
4  Ajjet  21.0      Delhi   74.0 

New Series 

0    119.0
1    118.0
2      NaN
3      NaN
4     95.0
dtype: float64
<class 'pandas.core.series.Series'>
  • Method 3-Add two columns to make a new column

We know that a dataframe is a group of series. We see that when we add two columns it gives us a series and we store that sum in a variable. If we make that variable a column in the dataframe then our work will be easily done. Let see this with the help of an example.

import pandas as pd 
import numpy as np 
students = [('Raj', 24, 'Mumbai', 95) , 
('Rahul', 21, 'Delhi' , 97) , 
('Aadi', 22, 'Kolkata',76) , 
('Abhay',23,'Rajasthan' , 90) , 
('Ajjet', 21, 'Delhi' , 74)] 
# Create a DataFrame object 
df = pd.DataFrame( students, columns=['Name', 'Age', 'City', 'Marks']) 
print("Original Dataframe\n") 
print(df,'\n') 
df['total'] = df['Marks'] + df['Age']
print("New Dataframe \n") 
print(df)
 
print(df)

Output

Original Dataframe

    Name  Age       City  Marks
0    Raj   24     Mumbai     95
1  Rahul   21      Delhi     97
2   Aadi   22    Kolkata     76
3  Abhay   23  Rajasthan     90
4  Ajjet   21      Delhi     74 

New Dataframe 

    Name  Age       City  Marks  total
0    Raj   24     Mumbai     95    119
1  Rahul   21      Delhi     97    118
2   Aadi   22    Kolkata     76     98
3  Abhay   23  Rajasthan     90    113
4  Ajjet   21      Delhi     74     95
  • Method 4-Add two columns with NaN values to make a new column

The same is the case with NaN values. But here NaN values will be shown.Let see this with the help of an example.

import pandas as pd 
import numpy as np 
students = [('Raj', 24, 'Mumbai', 95) , 
            ('Rahul', 21, 'Delhi' , 97) , 
            ('Aadi', 22, 'Kolkata', np.NaN) , 
            ('Abhay', np.NaN,'Rajasthan' , 90) , 
            ('Ajjet', 21, 'Delhi' , 74)] 
# Create a DataFrame object 
df = pd.DataFrame( students, columns=['Name', 'Age', 'City', 'Marks']) 
print("Original Dataframe\n") 
print(df,'\n') 
df['total'] = df['Marks'] + df['Age']
print("New Dataframe \n") 
print(df)

Output

Original Dataframe

    Name   Age       City  Marks
0    Raj  24.0     Mumbai   95.0
1  Rahul  21.0      Delhi   97.0
2   Aadi  22.0    Kolkata    NaN
3  Abhay   NaN  Rajasthan   90.0
4  Ajjet  21.0      Delhi   74.0 

New Dataframe 

    Name   Age       City  Marks  total
0    Raj  24.0     Mumbai   95.0  119.0
1  Rahul  21.0      Delhi   97.0  118.0
2   Aadi  22.0    Kolkata    NaN    NaN
3  Abhay   NaN  Rajasthan   90.0    NaN
4  Ajjet  21.0      Delhi   74.0   95.0

So these are the methods to add two columns in the dataframe.

Pandas: Create Dataframe from List of Dictionaries

Methods of creating a dataframe from a list of dictionaries

In this article, we discuss different methods by which we can create a dataframe from a list of dictionaries. Before going to the actual article let us done some observations that help to understand the concept easily. Suppose we have a list of dictionary:-

list_of_dict = [
{'Name': 'Mayank' , 'Age': 25, 'Marks': 91},
{'Name': 'Raj', 'Age': 21, 'Marks': 97},
{'Name': 'Rahul', 'Age': 23, 'Marks': 79},
{'Name': 'Manish' , 'Age': 23},
]

Here we know that dictionaries consist of key-value pairs. So we can analyze that if we make the key as our column name and values as the column value then a dataframe is easily created. And we have a list of dictionaries so a dataframe with multiple rows also.

pandas.DataFrame

This methods helps us to create dataframe in python

syntax: pandas.DataFrame(data=None, index=None, columns=None, dtype=None, copy=False)

Let us see different methods to create dataframe from a list of dictionaries

  • Method 1-Create Dataframe from list of dictionaries with default indexes

As we see in in pandas.Datframe() method there is parameter name data.We have to simply pass our list of dictionaries in this method and it will return the dataframe.Let see this with the help of an example.

import pandas as pd
import numpy as np

list_of_dict = [
    {'Name': 'Mayank' ,  'Age': 25,  'Marks': 91},
    {'Name': 'Raj',  'Age': 21,  'Marks': 97},
    {'Name': 'Rahul',  'Age': 23,  'Marks': 79},
    {'Name': 'Manish' ,  'Age': 23,  'Marks': 86},
]
#create dataframe
df=pd.DataFrame(list_of_dict)
print(df)

Output

   Age  Marks    Name
0   25     91  Mayank
1   21     97     Raj
2   23     79   Rahul
3   23     86  Manish

Here we see that dataframe is created with default indexes 0,1,2,3….

Now a question may arise if from any dictionary key-value pair is less than other dictionaries.So in this case what happened.Let understand it with the help of an example.

import pandas as pd
import numpy as np

list_of_dict = [
    {'Name': 'Mayank' ,  'Age': 25,  'Marks': 91},
    {'Name': 'Raj',  'Age': 21,  'Marks': 97},
    {'Name': 'Rahul',  'Marks': 79},
    {'Name': 'Manish' ,  'Age': 23},
]
#create dataframe
df=pd.DataFrame(list_of_dict)
print(df)

Output

    Age  Marks    Name
0  25.0   91.0  Mayank
1  21.0   97.0     Raj
2   NaN   79.0   Rahul
3  23.0    NaN  Manish

Here we see in case of missing key value pair NaN value is there in the output.

  • Method 2- Create Dataframe from list of dictionary with custom indexes

Unlike the previous method where we have default indexes we can also give custom indexes by passes list of indexes in index parameter of pandas.DataFrame() function.Let see this with the help of an example.

import pandas as pd
import numpy as np

list_of_dict = [
    {'Name': 'Mayank' ,  'Age': 25,  'Marks': 91},
    {'Name': 'Raj',  'Age': 21,  'Marks': 97},
    {'Name': 'Rahul',  'Marks': 79},
    {'Name': 'Manish' ,  'Age': 23},
]
#create dataframe
df=pd.DataFrame(list_of_dict,index=['a','b','c','d'])
print(df)

Output

    Age  Marks    Name
a  25.0   91.0  Mayank
b  21.0   97.0     Raj
c   NaN   79.0   Rahul
d  23.0    NaN  Manish

Here we see that instead of default index 1,2,3….. we have now indes a,b,c,d.

  • Method 3-Create Dataframe from list of dictionaries with changed order of columns

With the help of pandas.DataFrame() method we can easily arrange order of column by simply passes list ozf columns in columns parameter in the order in which we want to display it in our dataframe.Let see this with the help of example.

import pandas as pd
import numpy as np

list_of_dict = [
    {'Name': 'Mayank' ,  'Age': 25,  'Marks': 91},
    {'Name': 'Raj',  'Age': 21,  'Marks': 97},
    {'Name': 'Rahul',  'Age': 23,  'Marks': 79},
    {'Name': 'Manish' ,  'Age': 23,  'Marks': 86},
]
#create dataframe
df=pd.DataFrame(list_of_dict,columns=['Name', 'Marks', 'Age'])
print(df)

Output

     Name  Marks  Age
0  Mayank     91   25
1     Raj     97   21
2   Rahul     79   23
3  Manish     86   23

Here also a question may arise if we pass less column in columns parameter or we pass more column in parameter then what happened.Let see this with the help of an example.

Case 1: Less column in column parameter

In this case the column which we don’t pass will be drop from the dataframe.Let see this with the help of an example.

import pandas as pd
import numpy as np

list_of_dict = [
    {'Name': 'Mayank' ,  'Age': 25,  'Marks': 91},
    {'Name': 'Raj',  'Age': 21,  'Marks': 97},
    {'Name': 'Rahul',  'Age': 23,  'Marks': 79},
    {'Name': 'Manish' ,  'Age': 23,  'Marks': 86},
]
#create dataframe
df=pd.DataFrame(list_of_dict,columns=['Name', 'Marks'])
print(df)

Output

     Name  Marks
0  Mayank     91
1     Raj     97
2   Rahul     79
3  Manish     86

Here we see that we didn’t pass Age column that’s why Age clumn is also not in our dataframe.

Case 2: More column in column parameter

In this case a new column will be added in dataframe but its all the value will be NaN.Let see this with the help of an example.

import pandas as pd
import numpy as np

list_of_dict = [
    {'Name': 'Mayank' ,  'Age': 25,  'Marks': 91},
    {'Name': 'Raj',  'Age': 21,  'Marks': 97},
    {'Name': 'Rahul',  'Age': 23,  'Marks': 79},
    {'Name': 'Manish' ,  'Age': 23,  'Marks': 86},
]
#create dataframe
df=pd.DataFrame(list_of_dict,columns=['Name', 'Marks', 'Age','city'])
print(df)

Output

     Name  Marks  Age  city
0  Mayank     91   25   NaN
1     Raj     97   21   NaN
2   Rahul     79   23   NaN
3  Manish     86   23   NaN

So these are the methods to create dataframe from list of dictionary in pandas.

Matplotlib: Line plot with markers

Methods to draw line plot with markers with the help of Matplotlib

In this article, we will discuss some basics of matplotlib and then discuss how to draw line plots with markers.

Matplotlib

We know that data that is in the form of numbers is difficult and boring to analyze. But if we convert that number into graphs, bar plots, piecharts, etc then it will be easy and interesting to visualize the data. Here Matplotlib library of python came into use. Matplotlib is a comprehensive library for creating static, animated, and interactive visualizations in Python.

For using this library we have to first import it into the program. For importing this we can use

from matplotlib import pyplot as plt or import matplotlib. pyplot as plt.

In this article, we only discuss the line plot. So let see the function in matplotlib to draw a line plot.

syntax:  plt.plot(x,y, scalex=True, scaley=True, data=None, marker=’marker style’, **kwargs)

Parameters

  1. x,y: They represent vertical and horizontal axis.
  2. scalex, scaley: These parameters determine if the view limits are adapted to the data limits. The default value is True.
  3. marker: It contains types of markers that can be used. Like point marker, circle marker, etc.

Here is the list of markers used in this

  • “’.’“           point marker
  • “’,’“           pixel marker
  • “’o’“          circle marker
  • “’v’“          triangle_down marker
  • “’^’“          triangle_up marker
  • “'<‘“          triangle_left marker
  • “’>’“          triangle_right marker
  • “’1’“          tri_down marker
  • “’2’“          tri_up marker
  • “’3’“          tri_left marker
  • “’4’“          tri_right marker
  • “’s’“          square marker
  • “’p’“          pentagon marker
  • “’*’“          star marker
  • “’h’“          hexagon1 marker
  • “’H’“         hexagon2 marker
  • “’+’“          plus marker
  • “’x’“          x marker
  • “’D’“         diamond marker
  • “’d’“          thin_diamond marker
  • “’|’“           vline marker
  • “’_’“          hline marker

Examples of Line plot with markers in matplotlib

  • Line Plot with the Point marker

Here we use marker='.'.Let see this with the help of an example.

import matplotlib.pyplot as plt
import numpy as np

x = np.arange(-5,40,.5)
y = np.sin(x)
plt.plot(x,y, marker='.')
plt.title('Sin Function')
plt.xlabel('x values')
plt.ylabel('y= sin(x)')
plt.show()

Output

  • Line Plot with the Point marker and give marker some color

In the above example, we see the color of the marker is the same as the color of the line plot. So there is an attribute in plt.plot() function marker face color or mfc: color which is used to give color to the marker. Let see this with the help of an example.

import matplotlib.pyplot as plt
import numpy as np

x = np.arange(-5,40,.5)
y = np.sin(x)
plt.plot(x,y, marker='.',mfc='red')
plt.title('Sin Function')
plt.xlabel('x values')
plt.ylabel('y= sin(x)')
plt.show()

Output

Here we see that color of the pointer changes to red.

  • Line Plot with the Point marker and change the size of the marker

To change the size of the marker there is an attribute in pointer ply.plot() function that is used to achieve this. marker size or ms attribute is used to achieve this. We can pass an int value in ms and then its size increases or decreases according to this. Let see this with the help of an example.

import matplotlib.pyplot as plt
import numpy as np

x = np.arange(-5,40,.5)
y = np.sin(x)
plt.plot(x,y, marker='.',mfc='red',ms='17')
plt.title('Sin Function')
plt.xlabel('x values')
plt.ylabel('y= sin(x)')
plt.show()

Output

Here we see that size of the pointer changes.

  • Line Plot with the Point marker and change the color of the edge of the marker

We can also change the color of the edge of marker with the help of markeredgecolor or mec attribute. Let see this with the help of an example.

import matplotlib.pyplot as plt
import numpy as np

x = np.arange(-5,40,.5)
y = np.sin(x)
plt.plot(x,y, marker='.',mfc='red',ms='17', mec='yellow')
plt.title('Sin Function')
plt.xlabel('x values')
plt.ylabel('y= sin(x)')
plt.show()

Output

Here we see that the color of the edge of the pointer changes to yellow.

So here are some examples of how we can work with markers in line plots.

Note: These examples are applicable to any of the marker.

Read Csv File to Dataframe With Custom Delimiter in Python

Different methods to read CSV files with custom delimiter in python

In this article, we will see what are CSV files, how to use them in pandas, and then we see how and why to use custom delimiter with CSV files in pandas.

CSV file

A simple way to store big data sets is to use CSV files (comma-separated files).CSV files contain plain text and is a well know format that can be read by everyone including Pandas. Generally, CSV files contain columns separated by commas, but they can also contain content separated by a tab, or underscore or hyphen, etc. Generally, CSV files look like this:-

total_bill,tip,sex,smoker,day,time,size
16.99,1.01,Female,No,Sun,Dinner,2
10.34,1.66,Male,No,Sun,Dinner,3
21.01,3.5,Male,No,Sun,Dinner,3
23.68,3.31,Male,No,Sun,Dinner,2
24.59,3.61,Female,No,Sun,Dinner,4

Here we see different columns and their values are separated by commas.

Use CSV file in pandas

read_csv() method is used to import and read CSV files in pandas. After this step, a CSV file act as a normal dataframe and we can use operation in CSV file as we use in dataframe.

syntax:  pandas.read_csv(filepath_or_buffer, sep=‘, ‘, delimiter=None, header=‘infer’, names=None, index_col=None, ….)

',' is default separator in read_csv() method.

Let see this with an example

import pandas as pd
data=pd.read_csv('example1.csv')
data.head()

Output

total_bill tip sex smoker day time size
0 16.99 1.01 Female No Sun Dinner 2
1 10.34 1.66 Male No Sun Dinner 3
2 21.01 3.50 Male No Sun Dinner 3
3 23.68 3.31 Male No Sun Dinner 2
4 24.59 3.61 Female No Sun Dinner 4

Why use separator or delimiter with read_csv() method

Till now we understand that generally, CSV files contain data separated data that is separated by comma but sometimes it can contain data separated by tab or hyphen, etc. So to handle this we use a seperator. Let understand this with the help of an example. Suppose we have a CSV file separated by an underscore and we try to read that CSV file without using a separator or with using default separator i.e. comma. So let see what happens in this case.

"total_bill"_tip_sex_smoker_day_time_size
16.99_1.01_Female_No_Sun_Dinner_2
10.34_1.66_Male_No_Sun_Dinner_3
21.01_3.5_Male_No_Sun_Dinner_3
23.68_3.31_Male_No_Sun_Dinner_2
24.59_3.61_Female_No_Sun_Dinner_4
25.29_4.71_Male_No_Sun_Dinner_4
8.77_2_Male_No_Sun_Dinner_2

Suppose this is our CSV file separated by an underscore.

total_bill_tip_sex_smoker_day_time_size
0 16.99_1.01_Female_No_Sun_Dinner_2
1 10.34_1.66_Male_No_Sun_Dinner_3
2 21.01_3.5_Male_No_Sun_Dinner_3
3 23.68_3.31_Male_No_Sun_Dinner_2
4 24.59_3.61_Female_No_Sun_Dinner_4

Now see when we didn’t use a default separator here how unordered our data look like. So to solve this issue we use Separator. Now we will see when we use a separator to underscore how we get the same data in an ordered manner.

import pandas as pd 
data=pd.read_csv('example2.csv',sep = '_',engine = 'python') 
data.head()

Output

total_bill tip sex smoker day time size
0 16.99 1.01 Female No Sun Dinner 2
1 10.34 1.66 Male No Sun Dinner 3
2 21.01 3.50 Male No Sun Dinner 3
3 23.68 3.31 Male No Sun Dinner 2
4 24.59 3.61 Female No Sun Dinner 4

So this example is sufficient to understand why there is a need of using a separator of delimiter in pandas while working on a CSV file.

Now suppose there is a CSV file in while data is separated by multiple separators. For example:-

totalbill_tip,sex:smoker,day_time,size
16.99,1.01:Female|No,Sun,Dinner,2
10.34,1.66,Male,No|Sun:Dinner,3
21.01:3.5_Male,No:Sun,Dinner,3
23.68,3.31,Male|No,Sun_Dinner,2
24.59:3.61,Female_No,Sun,Dinner,4
25.29,4.71|Male,No:Sun,Dinner,4

Here we see there are multiple seperator used. So here we can not use any custom delimiter. To solve this problem regex or regular expression is used. Let see with the help of an example.

import pandas as pd 
data=pd.read_csv('example4.csv',sep = '[:, |_]') 
data.head()

Output

totalbill tip sex smoker day time size
0 16.99 1.01 Female No Sun Dinner 2
1 10.34 1.66 Male No Sun Dinner 3
2 21.01 3.50 Male No Sun Dinner 3
3 23.68 3.31 Male No Sun Dinner 2
4 24.59 3.61 Female No Sun Dinner 4

When we notice we pass a list of separators in the sep parameter that is contained in our CSV file.

Want to expert in the python programming language? Exploring Python Data Analysis using Pandas tutorial changes your knowledge from basic to advance level in python concepts.

Python: Select an Element or Sub Array by Index From a Numpy Array

Select an element or subarray by index from a Numpy array

In this article, we will discuss how we can access elements of numpy array using indexes and how to access subarray of Numpy array using slicing or range of indexes.

Access element of Numpy array using indexes

As we all know array is a data structure in which elements are stored in a contiguous memory location. Hence it is easy to access array elements using an index. The same is with the case of the Numpy array. We can access elements of the Numpy array using indexes. As we implement this in python so we can access array elements using both positive and negative indexes.

Positive index starts from 0 and it used to access the first element and using index 1,2,3………. we can access further elements. Negative index start from -1 and it used to access the last element and using index -2,-3,-4……… we can access furthermost elements. Let see this with the help of an example.

import numpy as np
#creating Numpy array
npArray=np.array([1, 2, 3, 4, 5,6,7,8,9,10])
print(npArray)
#np[0] acess first element
print(npArray[0])
#np[-1] acess last element 
print(npArray[-1])
#np[3] access 4th element from start
print(npArray[3])
#np[-3] access 3rd element from last
print(npArray[-3])

Output

[ 1  2  3  4  5  6  7  8  9 10]
1
10
4
8

Access subarray of Numpy array using slicing or range of indexes

When we study the list in python we see that we can access the subarray of the list using slicing. Its syntax looks like this:

Suppose L is a list we can access the subarray of the list using L[a:b] where a denote starting index while b-1 denotes the last index of the subarray. In a similar way, we can implement this concept in a Numpy array.

Now we see different structures of slicing for positive index

1) L[a:b]-> a denote starting index of numpy array and b-1 denotes last index of numpy array.

import numpy as np
#creating Numpy array
npArray=np.array([1, 2, 3, 4, 5,6,7,8,9,10])
print(npArray)
#Here we start from 3rd index and stop at 5th index
print(npArray[3:6])

Output

[ 1  2  3  4  5  6  7  8  9 10]
[4 5 6]

2) L[:b]-> Here a becomes starting index of the whole array i.e a is equal to zero and b-1 denotes the last index of the numpy array.

import numpy as np
#creating Numpy array
npArray=np.array([1, 2, 3, 4, 5,6,7,8,9,10])
print(npArray)
#Here we start from 0th index and stop at 5th index
print(npArray[:6])

Output

[ 1  2  3  4  5  6  7  8  9 10]
[1 2 3 4 5 6]

3) L[a:]-> a denote starting index of the numpy array and b becomes the last index of the whole array.

import numpy as np
#creating Numpy array
npArray=np.array([1, 2, 3, 4, 5,6,7,8,9,10])
print(npArray)
#Here we start from 2nd index and stop at last index
print(npArray[2:])

Output

[ 1  2  3  4  5  6  7  8  9 10]
[ 3  4  5  6  7  8  9 10]

4) L[a:b:c] -> a denote starting index of numpy array and b-1 denotes the last index of numpy array and c-1 denote how many elements we have to skip in between. The default value of c is 1.

import numpy as np
#creating Numpy array
npArray=np.array([1, 2, 3, 4, 5,6,7,8,9,10])
print(npArray)
#Here we start from 2nd index and stop at sixth index and leave 1 element in  between
print(npArray[2:7:2])

Output

[ 1  2  3  4  5  6  7  8  9 10]
[3 5 7]

5) L[a::c] -> a denote starting index of the numpy array and b becomes the last index of the whole array and c-1 denotes how many elements we have to skip in between. The default value of c is 1.

import numpy as np
#creating Numpy array
npArray=np.array([1, 2, 3, 4, 5,6,7,8,9,10])
print(npArray)
#Here we start from 2nd index and stop at last index and leave 1 element in  between
print(npArray[2::2])

Output

[ 1  2  3  4  5  6  7  8  9 10]
[3 5 7 9]

Now we see different structures of slicing for the Negative index

1) L[a:b:c]-> a denote starting index of numpy array and b denotes last index of numpy array.Here c=-1 means we have to skip 0 elements,c=-2 means we have to skip 1 element, and so on

import numpy as np
#creating Numpy array
npArray=np.array([1, 2, 3, 4, 5,6,7,8,9,10])
print(npArray)
#Here we start from 1st index from last and stop at 5th index from last 
print(npArray[-1:-5:-1])

Output

[ 1  2  3  4  5  6  7  8  9 10]
[10  9  8  7]

2) L[a::c]-> a denote starting index of the numpy array and b becomes the last index of the whole array. Here c=-1 means we have to skip 0 elements,c=-2 means we have to skip 1 element, and so on.

import numpy as np
#creating Numpy array
npArray=np.array([1, 2, 3, 4, 5,6,7,8,9,10])
print(npArray)
#Here we start from last index and stop at 5th index from last leaving 1 element
print(npArray[:-5:-2])

Output

[ 1  2  3  4  5  6  7  8  9 10]
[10  8]

3) 5) L[a::c] -> a denote starting index of the numpy array and b becomes the last index of the whole array. Here c=-1 means we have to skip 0 elements,c=-2 means we have to skip 1 element, and so on.

import numpy as np
#creating Numpy array
npArray=np.array([1, 2, 3, 4, 5,6,7,8,9,10])
print(npArray)
#Here we start from second index from last and stop at last index from last leaving 1 element
print(npArray[-2::-2])

Output

[ 1  2  3  4  5  6  7  8  9 10]
[9 7 5 3 1]

So these are the methods select an element or subarray by index from a Numpy array.